Technical Note 5 – UV/Vis Spectrophotometer – Protein UV Performance Data

Proteins, the dynamic parts of living cells, are involved in nearly all metabolic pathways of cells (e.g. enzymatic reactions, immune protection, and cellular response). The measurement of protein concentrations is frequently used in life science research. Although there are many assays available, care should be taken to select the optimum assay for the particular sample type. The decision on which assay to use is typically based on convenience, quantity and purity of protein available. It is also possible to measure labeled proteins via the absorbance maxima of the dye. Dye concentration and the frequency of incorporation are calculated and displayed automatically.
In this technical note, we describe the performance of the NanoPhotometer® NP80 in terms of linearity and accuracy, applying small volume protein quantification at 280 nm (Protein UV280). Protein samples display a characteristic absorption spectrum at 280 nm, predominantly from the aromatic amino acids phenylalanine, tyrosine, and tryptophan. The Lambert-Beer law can be applied to determine the protein concentration in a sample.

This UV based approach depends strongly on the purity and primary sequence of a protein. Some components which are commonly present in protein samples show strong UV absorbance, and should be corrected for or avoided altogether. The NanoPhotometer® unique feature Blank Control™ will automatically warn the user if high background is present in a blank from buffers or contaminants (see also Technical Note #3 Blank Control™ and Appendix 1).

Material & Methods

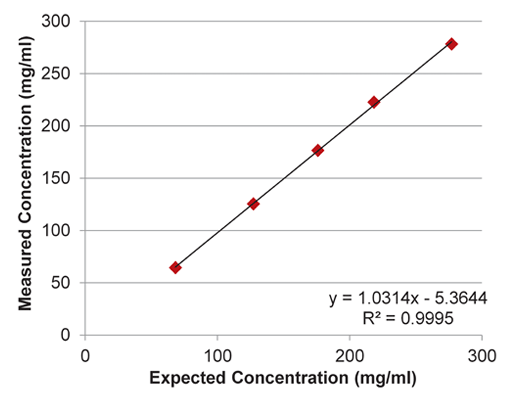
Bovine serum albumin (BSA) solution A7284 (Lot. SLBP4169V) from Sigma-Aldrich was used as stock solution. Different sample concentrations were achieved by dilution with defined amount of 1x PBS buffer. The dilution ratio was controlled by weight via microbalance (Sartorius BP221S). Expected absorbance values were measured in 10 mm quartz glass cuvettes (Hellma Analytics 100-QS) with UV/VIS spectrometer UVIKON XL (serial number 110178). All measurements were done on the Protein UV Spectrophotometer, NanoPhotometer® NP80 (serial number M80706).
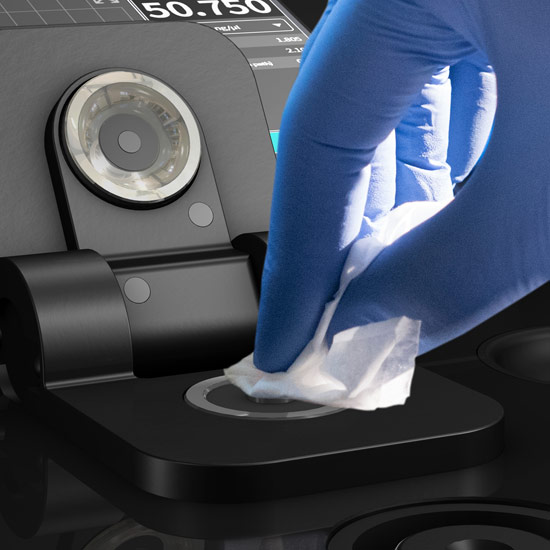
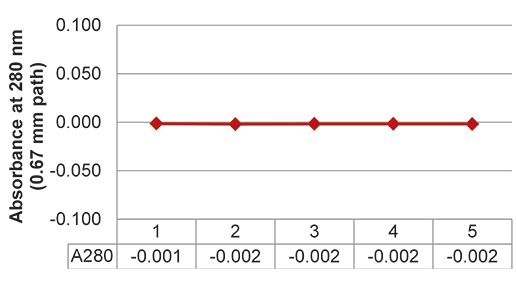
Each protein concentration was measured using Protein UV Spectrophotometer NP80 five times without prior dilution using a sample volume of 1 μl. Each sample was vortexed before every measurement to ensure sample homogeneity. After each measurement, the pedestal and the lid of Protein UV Spectrophotometer NP80 were cleaned with a slightly wet lint free tissue and a new aliquot of the sample was pipetted.
implen-nanophotometer-NP80-for-protein assay-measurement-applications-nanodrop-alternative-cleaning-lid

Precision and Accuracy of the Protein UV Spectrophotometer Measurement Results

Accuracy Results

The expected protein concentration was compared to the mean value of the five measured concentrations of each protein samples (Table 1). Additionally, the standard deviation of the mean absorbance at the 0.67 mm / 0.07 mm path of each sample is listed.

Linearity Results

The resulting linearity curve in the range of 0.0380 – 276.98 mg/ml shows a close correlation between expected and measured concentrations with a coefficient of determination (R2) of 0.9997 (Figure 1). Figure 2 shows the linearity for low concentration samples measured with path length 0.67 (dilution factor 15).

Ratio

The Protein UV Spectrophotometer, NanoPhotometer® NP80,  calculates the 260/280 ratio which accounts for contaminants in the sample. The 260/280 ratio primarily indicates the presence of nucleic acids in the protein sample. Purified protein preparations have an expected ratio of around 0.57. Protein samples used within this technical note had 260/280 ratios between 0.585 and 0.636 for concentrations in a range of 0.705 – 276.8 mg/ml. Figure 3 shows the linearity of high concentrated BSA samples in the range of 68.326 – 276.98 mg/ml.

implen-nanophotometer-protein-uv-mean-absorbance-0.67---0.07-mm-path

Table 1. NP80 Expected vs. Measured Protein Concentrations

implen-nanophotometer-protein-UV-measurement-applications-nanodrop-alternative1-linearity-results

Figure 1:
Protein samples (mean value) in the range of
0.038 – 276.98 mg/ml
measured with the NP80 using
automatic path length selection.

implen-nanophotometer-protein-UV-measurement-applications-nanodrop-alternative2-linearity-results

Figure 2:
Protein samples (mean value) in the range of
0.038 – 39.097 mg/ml
measured with the NP80 using
path length 0.67 mm.

implen-nanophotometer-protein-UV-measurement-applications-nanodrop-alternative3-linearity-results

Figure 3:
Protein samples (mean value) in the range of
68.326 – 276.98 mg/ml
measured with NP80 using
path length 0.07 mm.

Carryover

Highly concentrated protein samples are known to be sticky. To show that cleaning with just a slightly wet lint-free tissue is appropriate, the blank solution (1x PBS) was measured five times after the final protein sample reading. No residual concentration of protein or absorbance at 280 nm was detected (Figure 4). The absorbance at 280 nm (0.67 mm path) is within the specified fluctuation of the lamp (± 0.002 A).

Figure 4:
No carryover was detected. Absorbance at 280 nm (0.67 mm path) of five 1x PBS measurements measured after the last protein sample

implen-nanophotometer-protein-uv-no-carryover-absorbance-280-nm

Discussion

This technical note shows excellent linearity of the NanoPhotometer® with a coefficient of determination (R2) of 0.9997 over the whole dynamic range for protein samples. Furthermore, the data prove that two precisely defined path lengths are sufficient for this excellent precision and linearity. The sealed mechanical setup of the NanoPhotometer® with two fixed anchor points guarantees accurate performance every time a sample is measured. Whilst in Figure 1 the whole dynamic range is being analyzed, Figure 2 and 3 focus on low/high concentrated samples. The results show very clearly that across the detection limits of the NanoPhotometer® NP80 precision and linearity of the instrument is highly reliable.

Summary

The data presented in this technical note show the high accuracy and linearity of the NanoPhotometer® across the entire dynamic range of the instrument. With this novel approach of only two precise path lengths with fixed anchor points utilizing the proprietary True Path Technology™ in a sealed optical environment, mechanical changes in the system are eliminated. For further technical information refer also to Technical Note #1 True Path Technology™. The NanoPhotometer® is the only instrument with True Path Technology™ providing accurate results without the need for recalibration throughout the entire lifetime of the instrument.
CHAMPS implen nanophotometer protein UV applications nanodrop alternative CHAPS
T-PER implen nanophotometer protein UV applications nanodrop alternative T-PER
PROTEASE INHIBITORS implen nanophotometer protein UV applications nanodrop alternative PROTEASE INHIBITORS
M-PER implen nanophotometer protein UV applications nanodrop alternative M-PER
NDSB implen nanophotometer protein UV applications nanodrop alternative NDSB

DTT

implen nanophotometer protein UV applications nanodrop alternative DTT

RIPA

implen nanophotometer protein UV applications nanodrop alternative RIPA
HEPES implen nanophotometer protein UV applications nanodrop alternative HEPES
For further questions or if assistance is needed, please contact your local Implen Support Team at [email protected] or [email protected].
Scroll to Top